
Key Takeaways
Fatigue assessment of welded steel infrastructure depends on the relationship between repeated loading, local stress, weld geometry, fabrication quality, and inspection evidence.
- Repeated stress ranges, rather than static strength alone, often govern service life.
- Weld toes, roots, attachments, and terminations require careful fatigue classification.
- Stress concentration factors help explain local amplification but do not replace an appropriate design method.
- Variable-amplitude load histories should be converted into defensible fatigue damage calculations.
- Good detailing, fabrication control, inspection, and life-cycle monitoring work together to reduce risk.
Fundamentals of fatigue in welded steel joints
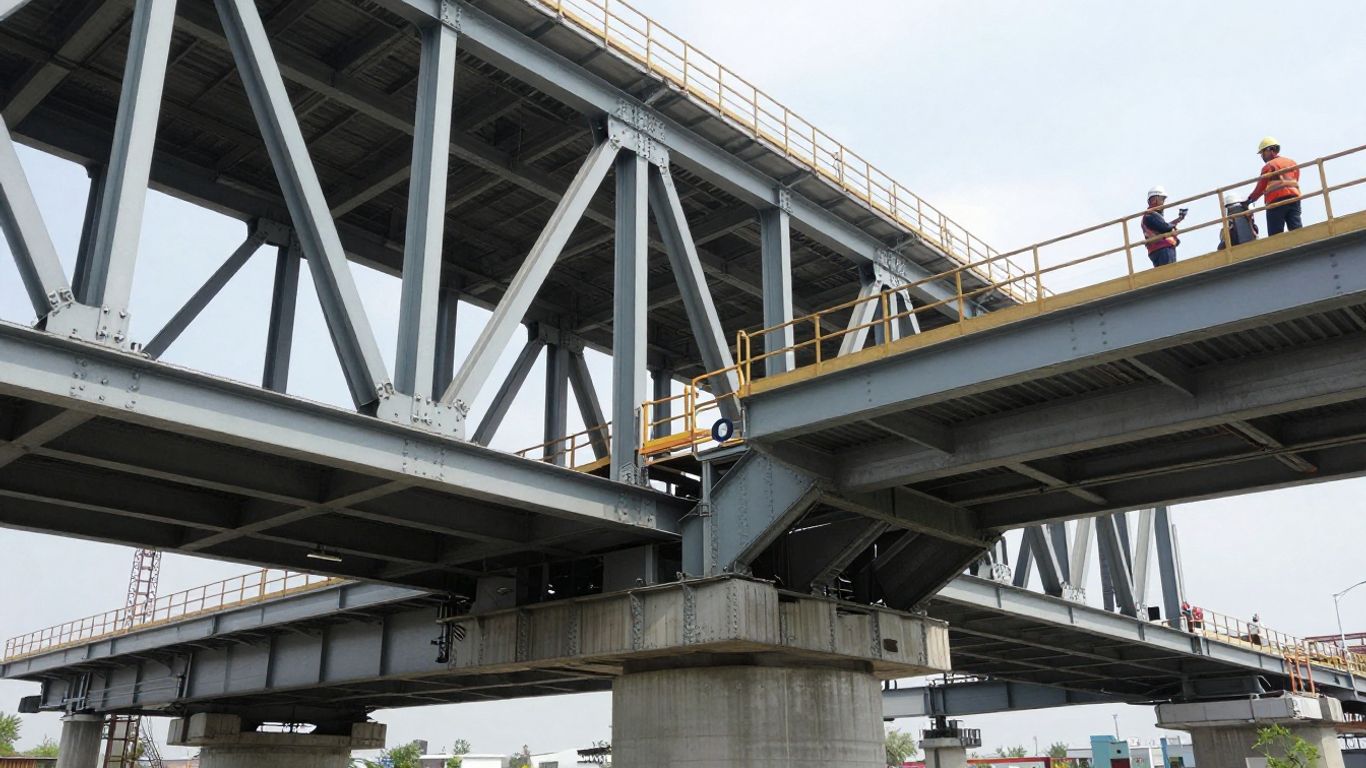
Welded steel infrastructure is routinely exposed to thousands or millions of load cycles during its working life. Bridges experience traffic effects, towers respond to wind, and offshore or marine structures face waves and operational vibration. A member can satisfy its static strength checks and still develop fatigue damage if the cyclic stress range is poorly understood. The assessment therefore connects structural loading with the behavior of specific welded details.
Why repeated loading governs infrastructure service life
Fatigue is driven by the repeated movement between stress levels, not simply by the largest force that a structure has ever carried. A modest stress range repeated many times can be more damaging than a rare extreme event, particularly at a notch or weld discontinuity. Service-life predictions must consequently reflect the expected number, sequence, and magnitude of cycles.
Infrastructure loading is rarely perfectly regular. Vehicle spacing, train speed, wind turbulence, equipment operation, and changing occupancy all alter the stress history. The engineer must distinguish design events used for ultimate strength from service events that control fatigue accumulation.
Fatigue crack initiation and propagation
A fatigue crack commonly begins at a location where local tensile stress and strain are elevated. In a welded joint, the weld toe, weld root, heat-affected zone, or a fabrication defect can provide the starting point. Once a crack forms, each suitable stress cycle can extend it incrementally, although the rate depends on stress intensity, geometry, environment, and crack size.
The practical implication is that fatigue assessment should not stop at a calculated nominal stress. It should identify where a crack could start, how it might travel through the connected plates, and what consequence that path would have for load redistribution and inspection access.
Welded joints as fatigue-critical details
Welding changes the local geometry and material condition of steel. The joint may contain a transition from plate to weld metal, residual stress from cooling, and a heat-affected zone with altered properties. These features make the connection detail, rather than the parent plate alone, the proper unit of fatigue assessment.
A useful stress concentration reference can clarify the distinction between geometry-driven amplification and fatigue behavior, but critical infrastructure decisions still require the governing design code, project assumptions, and competent engineering judgment. Detail classification drives the calculation because nominal stress limits and S–N data are tied to the form and quality of the welded joint.
High-cycle and low-cycle fatigue considerations
Most infrastructure fatigue problems fall within a high-cycle regime, where stresses remain largely elastic and the number of cycles is large. Some structures, however, may experience substantial cyclic inelasticity during seismic response, repeated heavy operations, construction stages, or abnormal events. Those conditions call for methods that account for strain range rather than relying solely on elastic stress range.
The boundary between regimes is not a substitute for engineering judgment. Material behavior, weld quality, strain concentration, and the expected number of cycles should be reviewed together, especially where seismic or operational demands can produce excursions beyond ordinary service loading.
How stress concentration factors influence fatigue performance
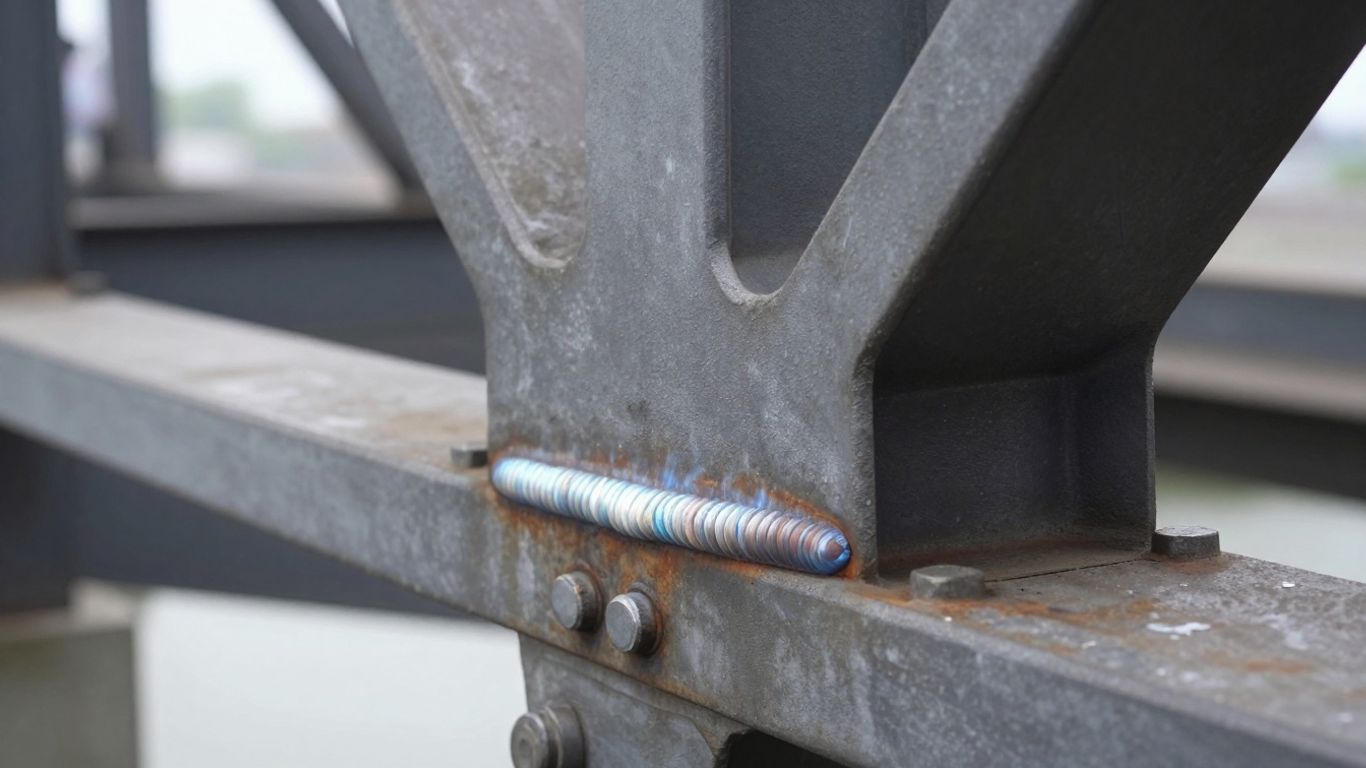
Stress concentration factors describe how a geometric discontinuity raises local stress relative to a chosen nominal reference. In welded steel, the discontinuity may be a weld toe radius, a root gap, an attachment end, a cope, or a sudden change in plate stiffness. These factors help engineers understand why fatigue cracks often occur at apparently small geometric features. They must, however, be used with a clearly defined stress method and reference section.
Geometric discontinuities at weld toes and roots
A sharp weld toe transition can force stress flow through a small radius, creating a local peak under cyclic tension or bending. At a weld root, incomplete penetration, eccentricity, or a notch-like profile may produce a similarly severe local effect. Attachment ends and abrupt terminations can intensify the problem by interrupting otherwise smooth force flow.
Improving the radius, aligning connected plates, and avoiding abrupt terminations can reduce the peak. The geometry should be represented realistically enough that the assessment reflects the fabricated detail rather than an idealized line drawing.
Distinguishing theoretical and fatigue stress concentration factors
The theoretical factor, commonly written as Kt, is a geometric ratio between a peak elastic stress and a nominal stress. A fatigue stress concentration factor, often written as Kf, attempts to reflect how the material and notch sensitivity influence fatigue response. They are related concepts, but they should not be treated as interchangeable inputs.
The difference matters because a sharp theoretical peak may not translate directly into the fatigue behavior assumed by a detail category or weld-specific S–N curve. The Kt and Kf guide is useful for orientation, while the selected code and validated reference should control a project calculation.
Local notch effects versus nominal stress methods
Nominal stress methods classify a welded detail and compare the calculated stress range with an S–N curve associated with that category. They are efficient when the joint resembles a recognized standard detail and the reference section is unambiguous. Local notch or effective notch stress methods instead resolve stresses closer to the actual discontinuity and can be useful for complex geometry.
Neither approach is automatically superior. A nominal method may avoid mesh-sensitive singular peaks, while a local method can distinguish geometric differences that a broad detail category cannot. The choice should match the available geometry, code provisions, and level of uncertainty.
When stress concentration factors are insufficient
A single factor cannot capture every fatigue influence in a welded infrastructure joint. Residual stresses, weld defects, misalignment, multiaxial loading, corrosion, plate thickness, and load sequence may all affect crack development. A factor taken from a simple geometry table can therefore be misleading when the actual detail departs materially from that geometry.
For unusual or highly consequential details, use refined finite element modeling, physical inspection data, fracture-mechanics methods, or a code-specific hot-spot procedure as appropriate. The analysis should explain its limitations rather than present a precise-looking factor without context.
Identifying fatigue-critical welded details
The first practical step in a fatigue review is to map the load paths and mark every welded detail where force enters, leaves, changes direction, or changes stiffness. Small attachments can be more critical than large members when they create local stress peaks. Access, drainage, corrosion exposure, and inspection visibility also influence the risk. A consistent detail inventory keeps the assessment focused on locations that can initiate consequential cracks.
Load-carrying fillet welds and attachment details
Load-carrying fillet welds transfer axial force, shear, or moment between connected components. Their fatigue behavior depends on weld size, effective throat, load direction, termination, and the surrounding plate geometry. Non-load-carrying attachments may still be critical because their weld toes interrupt the stress field of the primary member.
Connection drawings should identify the force path rather than merely list weld sizes. Where an attachment ends in a highly stressed flange or web, the transition length and termination shape deserve particular attention.
Butt welds, splice plates, and flange connections
Butt welds can perform well when alignment, penetration, profile, and inspection are controlled, but misalignment can introduce secondary bending. Splice plates add stiffness discontinuities and may concentrate stress around weld ends, bolt groups, or changes in plate thickness. Flange connections in bridges and industrial frames often combine global bending with local load effects.
The assessment should consider both the weld detail and the adjacent parent material. A sound weld does not eliminate fatigue risk if the connected plates have abrupt geometry or poor force distribution.
Stiffeners, diaphragm connections, and bracket terminations
Stiffeners and diaphragms help distribute load but can also create hard points that attract stress. Their ends are particularly important where the stiffener terminates near a flange, web opening, or change in restraint. Bracket corners and short returns can behave similarly, especially when welds are stopped in regions of high cyclic stress.
Detailing reviews should trace the stress flow beyond the connection itself. Extending or tapering a stiffener, reshaping a bracket, or moving a termination away from a peak can materially improve the fatigue detail without simply adding steel.
Weld defects, undercut, misalignment, and poor transitions
Undercut, overlap, lack of fusion, porosity, cracks, and incomplete penetration can reduce fatigue performance. Misalignment produces secondary bending and may increase the effective stress range even when the applied load is unchanged. Poor transitions and inconsistent weld profiles create additional local notches that are difficult to represent with a simple nominal calculation.
Fabrication records and inspection findings should therefore be part of the fatigue evidence. The engineer should distinguish an assumed design-quality detail from an as-built condition and assess whether repairs, restrictions, or additional inspection are needed.
Establishing loads and stress ranges
A fatigue calculation is only as credible as its load history. Infrastructure projects may combine permanent actions with traffic, rail, wind, wave, thermal, machinery, and seismic effects. The engineer must define which actions cycle, how they interact, and how often representative events occur. Conservative assumptions are useful only when their basis and consequences are understood.
Traffic, railway, wind, wave, and seismic loading
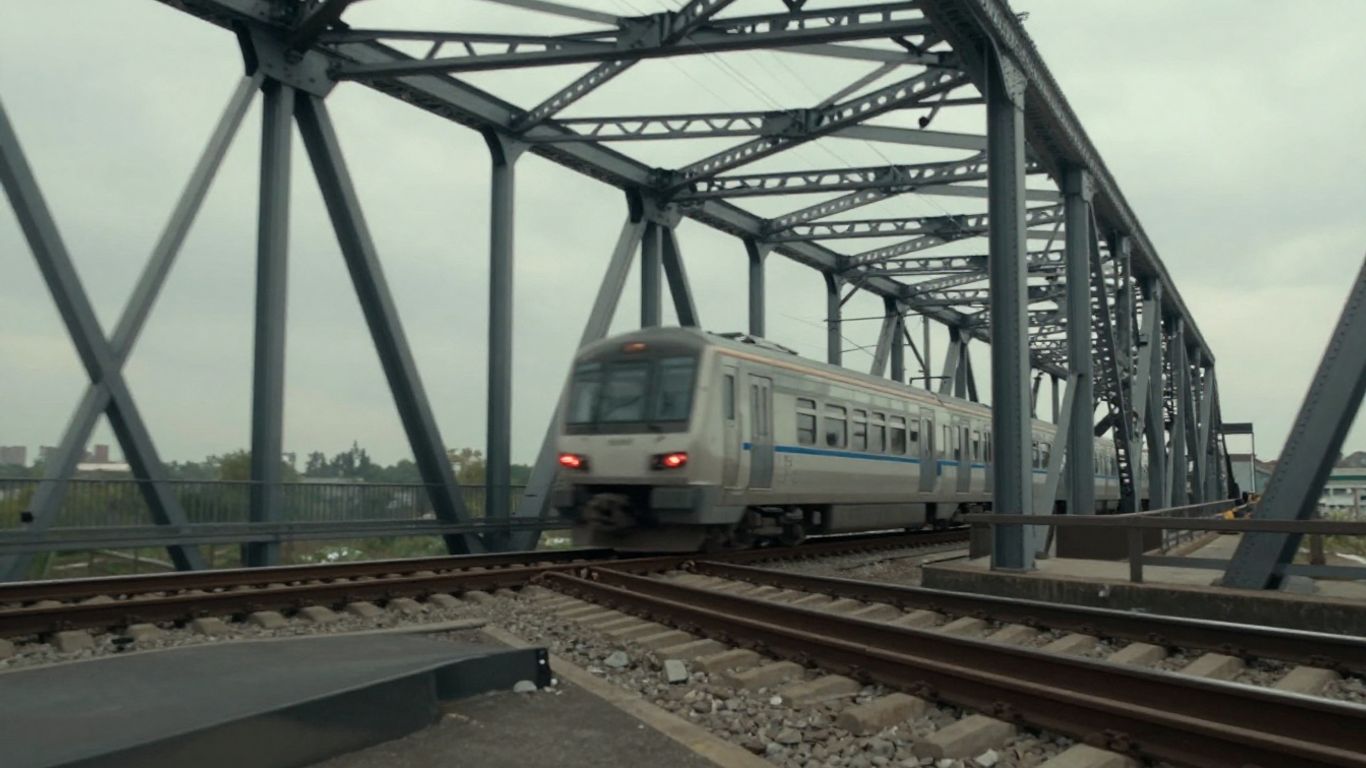
Road and railway structures are affected by axle configurations, vehicle or train speed, lane placement, dynamic amplification, and traffic growth. Wind-sensitive structures may respond to turbulence, vortex effects, or repeated directional changes. Offshore and coastal members face wave-induced cycles, while seismic loading can impose fewer but much larger excursions.
The relevant loading model depends on the asset and its operating environment. Local practice and applicable standards should be checked alongside project measurements, maintenance history, and realistic future use.
Load spectra and variable-amplitude service histories
A load spectrum groups stress cycles by range and frequency. It may be derived from measured strain, simulated vehicle passages, wind records, wave data, equipment duty cycles, or a code-prescribed distribution. Variable-amplitude histories are more representative than a single constant range, particularly when occasional heavy events contribute a meaningful share of damage.
Before calculation, the history should be cleaned, counted, and checked for sampling errors or unrealistic peaks. A defensible spectrum records its source, duration, scaling assumptions, and treatment of overloads.
Nominal, hot-spot, and effective notch stress approaches
Nominal stress is evaluated away from the local weld geometry and is appropriate for recognized details with established categories. Hot-spot stress extrapolates the structural stress near a weld toe while filtering out the immediate notch singularity. Effective notch stress models a reference notch radius to assess a local elastic peak.
The methods differ in mesh requirements, reference locations, and applicable fatigue data. The selected S–N curve must correspond to the stress definition; mixing a hot-spot stress with a nominal-stress category can produce an invalid result.
Combining axial, bending, and shear stresses
Welded joints commonly experience more than one stress component. Axial force may combine with in-plane or out-of-plane bending, while shear acts through the weld throat or connected plate. Stress ranges should be resolved consistently at the critical location and combined using the chosen code procedure.
A component-by-component check can miss a damaging phase relationship. Where loads are correlated, retain their timing or use a justified multiaxial fatigue rule rather than adding unrelated maxima.
Performing the fatigue assessment
The assessment should proceed from detail identification to load definition, stress calculation, code selection, and damage evaluation. Every result needs a traceable reference section, stress range, cycle count, and acceptance criterion. The process is not merely a software exercise; modeling assumptions and detail classification often govern the outcome. Independent review is valuable where the consequence of fatigue failure is high.
Selecting an appropriate design code and detail category
Select the governing standard before choosing the fatigue curve. International projects may require SS, BS, Eurocode, ACI-related provisions for associated work, or another contractual standard, while authority submissions may impose additional requirements. The selected code should define detail categories, stress conventions, thickness effects, weld quality assumptions, and inspection expectations.
A detail category should match the actual geometry and load transfer. If no category is a close fit, document the analogy, identify the differences, and consider a refined method or specialist review instead of forcing the joint into a convenient class.
Calculating stress range and fatigue damage
For each critical detail, determine the maximum and minimum stress in the relevant cycle and calculate the range using the project’s sign convention. Then associate that range with the appropriate number of repetitions and fatigue resistance curve. Results should be reported at the weld toe, root, throat, or reference line required by the method.
The following sequence provides a practical check on the calculation before results are accepted:
- Confirm the load spectrum and cycle-counting method.
- Verify the reference section and stress components.
- Match the stress definition to the selected fatigue curve.
- Check thickness, weld quality, and environmental adjustments.
- Record damage contributions and governing details.
This sequence helps expose errors that can remain hidden when only a final life estimate is reviewed. It also makes later updates easier when inspection or monitoring data becomes available.
Applying S–N curves and cumulative damage rules
S–N curves relate stress range to the number of cycles associated with a specified fatigue performance level. For variable-amplitude loading, cumulative damage rules such as Miner-type summation are commonly used, with each stress-range bin contributing a fraction of its allowable cycle count. The method is practical, but it is still an approximation of crack-growth behavior.
Use the curve required by the governing code and state any cut-off, slope change, thickness correction, or safety factor. A calculated damage ratio below unity is not a guarantee of crack-free service; it is one part of a structured engineering decision.
Accounting for mean stress, residual stress, and weld residual effects
Weld residual stresses can be substantial and may reduce the beneficial effect that a favorable mean stress would otherwise provide. Many welded-detail design curves implicitly account for residual stress under specified assumptions. Applying a separate mean-stress correction without checking the code basis can double-count or misrepresent the effect.
Residual stress can also change with stress relief, post-weld treatment, repair, temperature, or service history. These factors should be considered when moving beyond a standard design-curve assessment into a detailed fracture or remaining-life evaluation.
Using finite element analysis to resolve local stresses
Finite element analysis is useful for complex load paths, irregular connections, bracket ends, diaphragm details, and areas where nominal stress is difficult to define. The model should represent material properties, boundary conditions, connectivity, load introduction, and mesh refinement appropriately. For a broader workflow, analysis model verification offers useful context on checking assumptions rather than accepting computer output uncritically.
A very fine mesh does not automatically make a weld-toe singularity meaningful. Use the stress extraction procedure associated with the selected fatigue method, verify convergence where relevant, and compare local results with simplified equilibrium checks.
Improving fatigue resistance through design and fabrication
Fatigue resistance is often improved most economically before fabrication begins. Smoother force paths, fewer abrupt changes, accessible welds, and realistic tolerances reduce dependence on corrective work later. The design should also allow inspectors to see, reach, and test the locations that matter. These decisions support both structural performance and maintainability.
Reducing stress concentrations with smoother geometry
Gradual transitions distribute force over a larger region and reduce local stress amplification. Tapered attachments, generous radii, aligned plates, softened bracket corners, and carefully placed cut-outs are common measures. The objective is not to eliminate every concentration, which is rarely possible, but to avoid sharp and unnecessary ones.
Geometry should be coordinated with fabrication access and drainage. A theoretically smooth detail that traps water or cannot be welded consistently may perform worse in service than a slightly less elegant detail that can be produced and inspected reliably.
Specifying weld profiles, terminations, and access details
Drawings and specifications should state the required weld type, size, profile, termination, access arrangement, and inspection level. Welds should not terminate casually in a region of high cyclic stress, and the detail should allow the required profile to be achieved without unsafe or impractical access.
Clear connection details reduce interpretation at the shop floor. Where models and drawings are coordinated through Tekla Structures, the documented steel detailing capabilities include precise modeling of bolts, welds, and connection details; the engineering fatigue category and specification must still come from the design basis.
Managing weld quality, defects, and inspection requirements
Quality requirements should be proportionate to consequence and fatigue sensitivity. Welding procedures, qualified personnel, consumable control, fit-up, preheat where required, dimensional tolerances, and visual inspection all affect the final detail. Nondestructive examination should target likely crack paths and defects rather than serve as a generic paperwork exercise.
Acceptance criteria must be defined before fabrication and linked to the governing standard. If a defect is found, its size, location, orientation, and effect on the stress field should inform the disposition.
Considering post-weld treatments and repair strategies
Grinding, toe dressing, peening, or other post-weld treatments can improve a fatigue detail when correctly specified and verified. Their benefit depends on the treatment method, depth, continuity, workmanship, and compatibility with the design curve or assessment procedure. They are not a universal substitute for good geometry.
Repairs should remove the damaging condition without introducing a new abrupt termination or residual defect. After repair, inspect the affected area, update the as-built record, and reassess the detail if its geometry or load path has changed.
Monitoring and managing fatigue during the asset life cycle
Fatigue management continues after construction. Inspection planning should be based on predicted crack locations, consequences of failure, accessibility, exposure, and the uncertainty in the original assessment. A baseline establishes what was present at handover and provides a reference for later changes. The same logic applies to new and existing infrastructure.
Baseline inspections and condition assessment
A baseline inspection records weld appearance, coating condition, corrosion, distortion, repairs, and any visible cracking. It should identify the actual configuration, not simply confirm that drawings exist. Photographs, location references, weld maps, and dimensional observations make future comparisons more reliable.
For older assets, the baseline may also require a review of alterations, changes in traffic or operation, and past incidents. These can materially change the assumed fatigue spectrum.
Nondestructive testing for crack detection
Visual inspection is valuable but may not detect tight or subsurface cracks. Ultrasonic, magnetic particle, dye penetrant, radiographic, or other suitable methods can be selected according to material, geometry, access, and likely crack orientation. Method capability and operator qualification should be considered alongside inspection frequency.
Testing should be concentrated at fatigue-critical details and repeated consistently when trend information is required. A negative result is meaningful only within the method’s detection limits and coverage.
Structural health monitoring and strain measurement
Strain gauges, accelerometers, displacement sensors, corrosion sensors, and other monitoring systems can provide evidence of actual structural response. Strain measurements may help validate stress ranges, while dynamic data can reveal changes in stiffness, connections, or operational loading. Monitoring plans should define sampling rates, calibration, data quality checks, and alarm thresholds.
Instrumentation is most useful when it answers a defined engineering question. Collecting data without a decision framework can create volume without improving fatigue management.
Updating fatigue predictions with field data
Field observations can refine assumptions about traffic volume, train patterns, wind response, equipment cycles, and environmental exposure. The updated information can be used to revise the load spectrum, compare measured and modeled stresses, and identify whether a detail is aging faster or slower than predicted.
Updates should preserve the original assumptions and show what changed. This creates an auditable chain from design prediction to observed performance rather than replacing one unexplained estimate with another.
Repair, strengthening, and remaining-life evaluation
When cracking or excessive damage is found, immediate decisions may include restricting loads, increasing inspection frequency, isolating the detail, or stabilizing the affected member. Permanent repair or strengthening should address the crack path and the underlying load concentration. Adding material without understanding the force flow can transfer fatigue demand to a neighboring detail.
Remaining-life evaluation may use updated S–N calculations, crack-growth analysis, measured data, and repair history. The conclusion should state uncertainty, inspection assumptions, and the conditions under which the predicted life remains valid.
Conclusion
Reliable fatigue analysis of welded steel joints combines realistic load histories, appropriate stress concentration factors, sound detail classification, controlled fabrication, and evidence from inspection or monitoring. For infrastructure projects governed by Singapore, UK, UAE, Malaysian, or other international requirements, the calculation should be traceable to the applicable code and the actual welded configuration. A disciplined life-cycle approach helps convert a one-time design check into a practical strategy for safe, durable asset management.
Frequently Asked Questions
What causes fatigue cracks in welded steel joints?
Fatigue cracks usually begin where cyclic tensile stress is locally elevated, such as a weld toe, weld root, attachment end, undercut, misalignment, or other geometric discontinuity. Repeated stress cycles then extend the crack.
What are stress concentration factors?
Stress concentration factors quantify the increase in local stress caused by a geometric discontinuity relative to a defined nominal stress. The value depends on geometry, loading, and the reference used for the nominal stress.
Is Kt the same as Kf?
No. Kt is a theoretical, geometry-based elastic stress concentration factor, while Kf is intended to reflect fatigue sensitivity as well as the notch effect. They should not be substituted for one another without an appropriate basis.
Which welded details are usually fatigue-critical?
Common critical details include load-carrying fillet welds, attachment ends, butt weld transitions, splice plates, flange connections, stiffener terminations, diaphragm joints, bracket corners, and locations affected by defects or misalignment.
How is fatigue damage calculated for variable loading?
A variable load history is commonly converted into stress-range bins and cycle counts. Each bin is compared with the relevant S–N curve, and the damage fractions are combined using a cumulative damage rule specified or accepted by the governing design approach.
Can finite element analysis predict fatigue life by itself?
Finite element analysis can resolve structural or local stresses, but it does not independently establish fatigue life. The result also depends on mesh and stress extraction methods, detail classification, fatigue curves, loading history, weld condition, and engineering interpretation.
What should be done when a fatigue crack is discovered?
The affected area should be documented, assessed, and made safe through appropriate restrictions or temporary measures. A qualified engineer should determine the crack significance, inspection or monitoring needs, repair method, and remaining-life implications.