
Introduction to Bridge Deck Deterioration
Concrete bridges represent critical infrastructure assets worldwide. They endure severe environmental and mechanical stresses daily. Heavy traffic induces continuous structural fatigue over time. Weather cycles introduce damaging thermal variations constantly. Deicing salts penetrate the porous concrete matrix quickly. This chemical ingress significantly accelerates deck deterioration1.
Subsurface delamination is a primary structural failure mode. Delaminations are horizontal cracks within the concrete. They form just above the reinforcing steel layers2. They remain completely invisible to standard visual inspections. Non-destructive testing (NDT) detects these hidden anomalies accurately3. Infrared thermography (IRT) is a highly effective NDT technique. It uses thermal imaging to map subsurface flaws. This comprehensive report explores IRT for bridge inspections.
The Physics of Concrete Deterioration
Bridge decks degrade through complex chemical and physical processes. Deicing salts introduce aggressive chloride ions into concrete. Water transports these ions through the porous matrix.
Chloride Diffusion and Fick’s Second Law
Fick’s Second Law models this transient diffusion process4. This mathematical model predicts chloride penetration rates accurately. The diffusion equation is defined formally5.
The variable is the chloride ion concentration. The variable is the continuous exposure time. The variable denotes the depth into the concrete. The term is the apparent chloride diffusion coefficient4.
The analytical solution utilizes the mathematical error function.
The term represents the surface chloride concentration. Corrosion initiates when concentration reaches a critical threshold7. Chlorides destroy the protective passive oxide film completely. This breakdown initiates active steel reinforcement corrosion rapidly.
Corrosion byproducts occupy more volume than original steel. This volumetric expansion creates massive internal tensile stresses. These internal stresses fracture the concrete matrix eventually. The resulting horizontal cracks are termed delaminations2.
Freeze-Thaw Cycles
Freeze-thaw cycles rapidly accelerate this deterioration process. Water infiltrates the porous concrete matrix very easily. Ambient temperatures drop below the freezing point overnight. Trapped water freezes and expands volumetrically8. This expansion creates immense internal hydrostatic pressure.
Repeated cycles severely fracture the surrounding concrete matrix. These fractures merge with corrosion-induced cracks easily. The ultimate result is widespread subsurface delamination.
Fundamentals of Infrared Thermography
Infrared thermography visualizes these hidden horizontal cracks. The technology operates on fundamental thermodynamic principles. Radiant energy emits from all physical objects constantly2. The emission rate depends on the object’s absolute temperature. It also depends on the material’s surface emissivity.
Heat Transfer Mechanisms
Three physical mechanisms govern thermal behavior in concrete. These are conduction, convection, and thermal radiation9. Conduction transfers heat via internal molecular vibration. Convection transfers heat to the surrounding air. Radiation exchanges heat with the solar environment9.
IRT primarily analyzes conductive heat flow disruptions. The diffusion equation for transient heat conduction is:
The variable represents the absolute temperature. The variable represents the elapsed time. The term represents the material’s thermal diffusivity. Thermal diffusivity equals conductivity divided by volumetric heat capacity9.
Thermal Contrast Generation
Solid concrete conducts heat downward very efficiently. Delaminations create insulating air gaps within the deck9. Air possesses an extremely low thermal conductivity10. Concrete thermal conductivity is roughly 1.6 W/mK10. Air thermal conductivity is merely 0.024 W/mK10. This enormous difference enables reliable defect detection.
Air gaps severely impede downward heat flow. Solar radiation actively heats the bridge deck surface. The concrete above a delamination traps this heat10. This localized area warms up much faster. It appears as a distinct hot spot2.
During nighttime hours, this thermodynamic process reverses entirely. The deck surface cools via radiant emission. The subsurface air gap blocks upward heat transfer10. The surface above the defect cools much faster. It appears as a cold spot at night10.
This temperature difference is the thermal contrast. Typical thermal contrast values range from 0.5 to 3 degrees9. A minimum contrast of 0.5 degrees is required11.
[Image Prompt 2: A side-by-side diagram showing the physics of passive infrared thermography on a concrete bridge deck. The left side shows daytime heating, with yellow sun rays hitting the deck. A red “hot spot” is visible above a subsurface crack (delamination) due to interrupted heat flow. The right side shows nighttime cooling, with blue arrows indicating heat escaping into the sky, and a blue “cold spot” above the same crack. Technical, scientific illustration style.]
Active vs. Passive Thermography
Infrared thermography surveys require a thermal excitation source. The two primary methodologies are active and passive thermography.
Passive Thermography
Passive thermography relies entirely on natural solar heating. The sun provides the necessary thermal energy12. It is ideal for directly exposed bridge decks. Passive IRT allows very rapid highway speed surveys9. Vehicle-mounted systems scan lanes without stopping traffic9.
Survey timing is critical for passive thermography. The optimum time is 5 to 9 hours post-sunrise12. Alternatively, surveys work 5 to 9 hours post-sunset12.
Active Thermography
Active thermography utilizes controlled artificial heat sources. High-energy halogen lamps provide this targeted thermal excitation9. Active methods inspect shaded bridge deck areas effectively9. Active IRT accurately estimates precise defect depths.
Shallow defects appear rapidly with high thermal contrast. Deeper defects require significantly longer observation times9. The equipment required is generally more expensive.
| Feature | Passive Thermography | Active Thermography |
| Heat Source | Solar radiation | Halogen lamps, flashes |
| Primary Use | Full bridge deck surveys | Shaded areas, laboratories |
| Survey Speed | Very fast | Slow |
| Depth Penetration | Up to 100 mm | Varies by excitation |
| System Complexity | Low | High |
ASTM D4788 Standard and Environmental Factors
The ASTM D4788 standard governs this NDT procedure13. It outlines strict environmental requirements for accurate testing. These protocols prevent erroneous false positive readings.
Solar Loading and Temperature
Solar loading is the primary heating source9. Decks require three hours of continuous direct sunshine. Minimum required solar radiation is 250 W-h/m²9. Ambient temperatures must strictly remain above freezing14. Ice forming inside cracks causes false thermal readings14.
Wind Speed and Surface Moisture
Wind speeds must stay below 30 mph2. High winds cause excessive convective surface cooling. This cooling destroys the required thermal contrast9. Surface moisture fundamentally alters concrete emissivity values11.
Wet surfaces frequently create false positive defect readings. The deck must be entirely dry and clean12. Oil stains and debris also distort thermal data12.
Comparing NDT Methods for Bridge Decks
No single NDT method is universally perfect. Engineers must select appropriate tools for specific conditions.
Chain Drag and Hammer Sounding
Chain dragging is a traditional, subjective acoustic method. Inspectors drag heavy chains across the concrete surface. Delaminated areas produce a hollow, muted sound2. It is extremely inexpensive and easy to perform.
However, it requires complete, disruptive lane closures. It relies heavily on subjective human auditory perception. It cannot evaluate asphalt-overlaid bridge decks9.
Ground Penetrating Radar (GPR)
Ground Penetrating Radar emits high-frequency electromagnetic waves. It detects deep anomalies and precise rebar locations. It evaluates asphalt-overlaid decks exceptionally well9. GPR provides reliable, quantitative defect depth information.
However, it requires highly complex data processing. Initial equipment procurement costs are exceptionally high.
Impact-Echo
Impact-echo uses targeted transient stress waves. It provides highly accurate defect depth measurements9. It works effectively on bare and overlaid decks. The survey speed is exceedingly slow. It requires tedious point-by-point manual testing operations.
| Property | IR Thermography | Chain Drag | Impact-Echo | GPR |
| Survey Speed | Very fast | Slow | Very slow | Fast |
| Traffic Closure | No | Yes | Yes | No |
| Depth Info | No (mostly) | No | Yes | Yes |
| Overlaid Decks | Yes (up to 100 mm) | No | Yes | Yes |
| Data Output | Temperature map | Subjective sound | Frequency spectra | Radargram |
| Equipment Cost | Moderate | Low | Moderate | High |
Thermal Camera Technologies
Thermal camera selection dictates inspection success entirely. Sensor quality determines the ultimate data reliability.
LWIR vs. MWIR Cameras
Long-wave infrared cameras are current industry standards. They capture the 8-14 micron spectral band15. LWIR sensors utilize uncooled microbolometer technology15. They excel at detecting ambient temperature variations.
They do not require complex cryogenic cooling systems16. This makes them lighter and highly power-efficient. Mid-wave infrared cameras operate very differently. They capture the 3-5 micron spectral band15.
MWIR sensors require heavy, expensive cryogenic cooling. They provide extreme sensitivity for high-temperature industrial targets. However, they are heavy and mechanically complex15. LWIR is generally preferred for civil infrastructure inspections16.
Noise Equivalent Temperature Difference (NETD)
Noise Equivalent Temperature Difference defines thermal sensitivity. NETD measures the smallest detectable temperature difference17. Lower NETD values indicate superior thermal sensitivity. It is typically expressed in milli-Kelvins (mK).
A 50 mK NETD detects minute temperature variations18. High atmospheric humidity reduces image thermal contrast. Low NETD sensors perform reliably in high humidity17.
Camera frame rates also impact survey quality. Slow shutter speeds cause severe motion blur. High exposure rates prevent false detections at highway speeds19.
UAV Integration and Photogrammetry
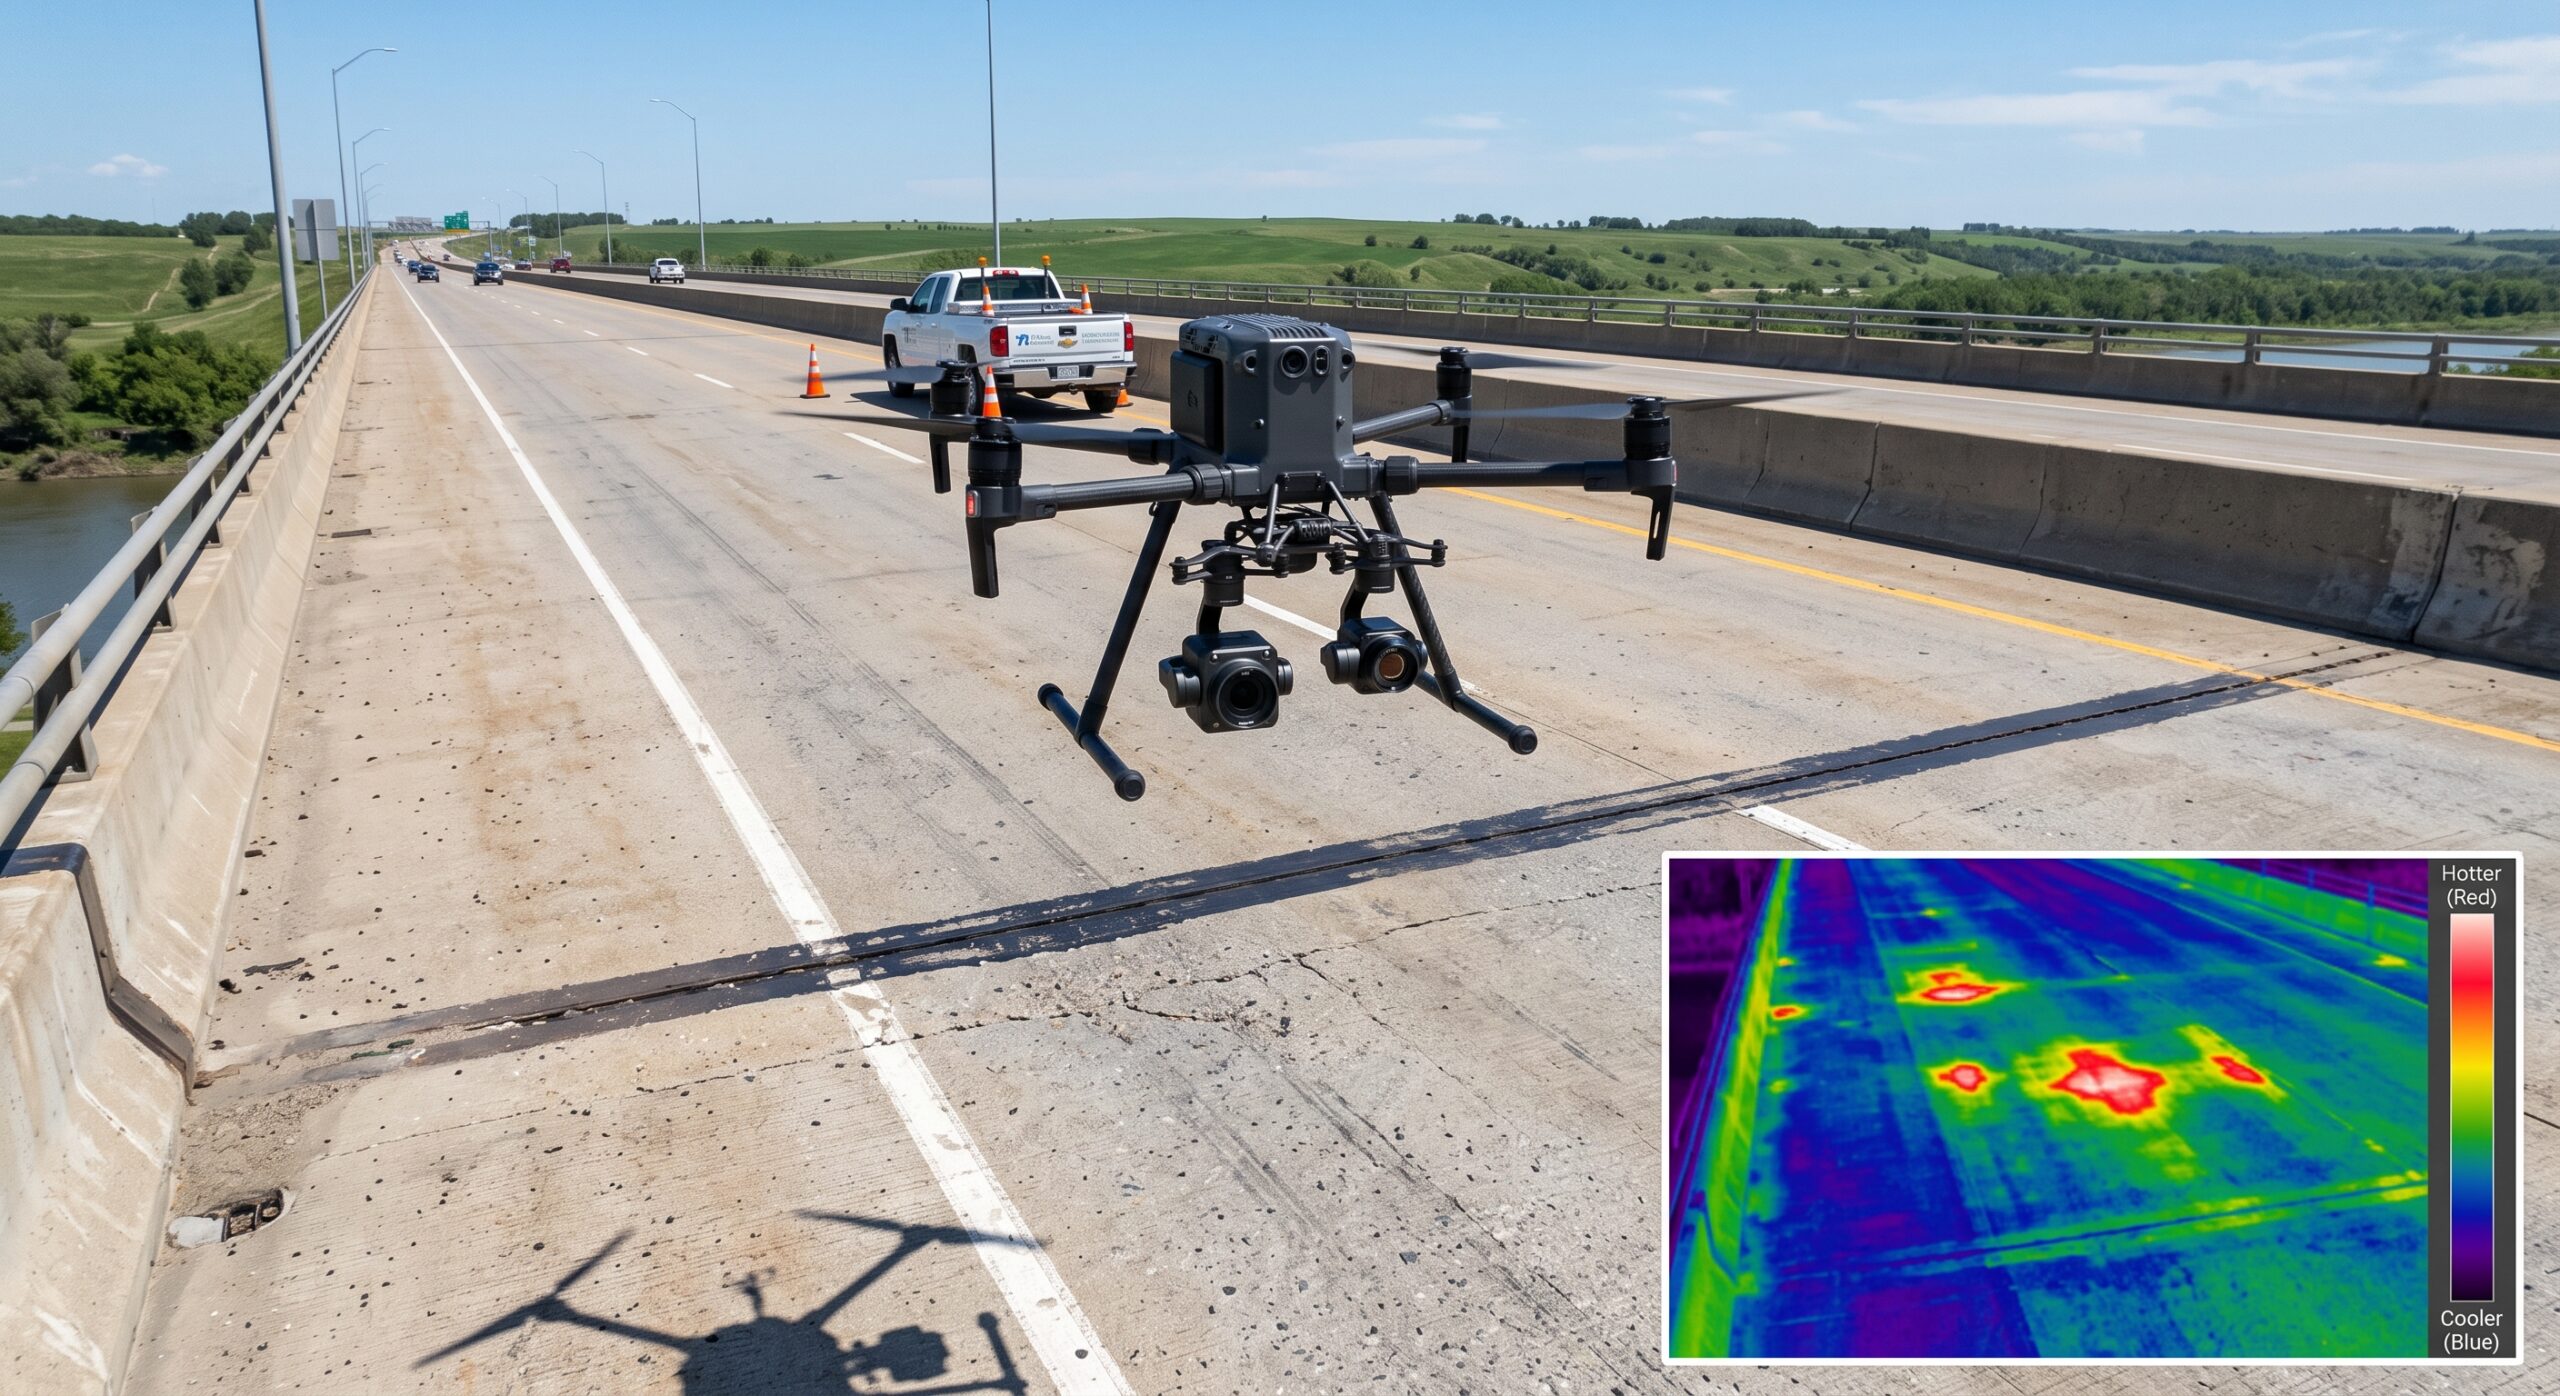
Unmanned Aerial Vehicles transform bridge inspection workflows. Drones carry high-resolution thermal imaging camera payloads. They scan massive bridge decks extremely rapidly. They eliminate the need for dangerous lane closures. The FAA Part 107 framework regulates drone operations20.
Ground Sampling Distance (GSD)
Ground Sampling Distance is a crucial photogrammetry metric. GSD defines the spatial resolution of digital images21. It measures physical ground area per image pixel. Lower GSD values provide much finer image details. A 1 cm GSD detects tiny thermal anomalies22.
GSD depends heavily on the drone’s flight altitude. It also depends on specific camera sensor dimensions.
The variable represents the drone’s flight altitude23. The term represents the physical camera sensor width. The term represents the exact lens focal length. The term represents the total image width23.
Flight Planning for Thermography
Flying lower drastically improves the spatial GSD resolution. However, it increases the required image count. Higher altitudes reduce detail but cover more area22. Engineers balance spatial resolution against data processing time.
A GSD of 1-3 cm is highly recommended21. The DJI Zenmuse H20T is a popular payload. It features an uncooled VOx microbolometer sensor18. It possesses a 58 mm equivalent focal length18. Its NETD is under 50 mK at f/1.018. This provides exceptional aerial thermal data collection.
Advanced Thermographic Signal Processing
Raw thermal images contain significant environmental noise. Signal processing algorithms isolate true thermal anomalies. These algorithms improve the signal-to-noise ratio drastically24.
Thermographic Signal Reconstruction (TSR)
Thermographic Signal Reconstruction reduces random temporal noise25. TSR analyzes each pixel’s temperature cooling curve. It fits a high-order logarithmic polynomial to data.
The term is the localized temperature increase25. The variable is the total elapsed cooling time. The polynomial coefficients compress the thermal data25.
Logarithmic derivatives of this polynomial enhance visual contrast. First and second derivatives highlight hidden subsurface defects26. TSR enables quantitative depth estimation of concrete delaminations.
Pulsed Phase Thermography (PPT)
Pulsed Phase Thermography is another highly powerful method. PPT applies a discrete one-dimensional Fourier transform10. It converts time-domain data into frequency-domain data. It generates both amplitude and phase images.
Phase images resist variations in concrete surface emissivity27. They also resist effects of uneven surface heating. This makes PPT highly robust for outdoor applications.
Principal Component Thermography (PCT)
Principal Component Thermography reduces thermal data dimensionality. PCT uses Singular Value Decomposition on thermal images28. It extracts the most meaningful spatial thermal patterns. It separates defect signals from random background noise.
Advanced variants include Sparse Principal Component Thermography28. These variants preserve the spatial connectivity of pixels.
Artificial Intelligence in Thermal Analysis
Analyzing thousands of thermal images is extremely tedious. Artificial intelligence rapidly accelerates thermal data analysis29. Deep learning models classify structural defects with precision.
Object Detection with YOLOv8
YOLOv8 is a state-of-the-art object detection algorithm30. It processes thermal images in real-time accurately. It draws bounding boxes around detected concrete delaminations. It learns complex thermal patterns from training datasets. It distinguishes true defects from surface oil stains.
Semantic Segmentation
Semantic segmentation models provide pixel-level defect boundaries31. They classify every single pixel in the image. UNet and SegFormer are highly popular segmentation architectures32. They map the exact size of hidden delaminations.
AI drastically reduces subjective errors by human inspectors. It processes massive drone datasets very rapidly.
Multi-Modal NDT Data Fusion
No single NDT method detects all bridge defects. Data fusion combines multiple complementary sensing technologies33.
Fusing GPR and IRT
Ground Penetrating Radar detects deep structural anomalies reliably. It identifies rebar corrosion and deep structural voids9. IRT detects shallow, near-surface delaminations extremely effectively.
Fusing GPR and IRT provides comprehensive structural assessments33. Physics-Enhanced Multi-Modal Fusion frameworks align this diverse data33. They create a complete 3D structural condition map.
Long-Term Bridge Performance (LTBP) Program
The FHWA Long-Term Bridge Performance program supports this34. The LTBP program aggregates national bridge inspection data. It collects NDT data across decades of service34.
It develops predictive deterioration models using this data. This helps agencies optimize their maintenance funding allocations.
Bridge Life-Cycle Cost Analysis
Bridge deck replacement involves massive capital expenditures. Early defect detection lowers life-cycle costs significantly35.
Preventive Maintenance Strategies
Preventive maintenance strategies rely heavily on NDT data. Minor patching repairs address localized severe concrete spalling36. Protective overlays seal the deck from external moisture37.
Overlays stop further chloride ion ingress very effectively. They add 15 to 20 years of service life38. Timely repairs delay expensive full deck replacements39.
Economic Benefits of Thermography
Full replacement causes massive user delay costs. It disrupts local economies and freight supply chains. IRT surveys cost a fraction of physical coring.
They provide actionable data for asset management systems. This ensures optimal allocation of scarce infrastructure funds. IRT extends the functional lifespan of aging bridges.
Conclusion
Infrared thermography revolutionizes concrete bridge deck inspections globally. It offers rapid, non-contact subsurface defect detection capabilities. Proper adherence to ASTM D4788 ensures testing accuracy.
Drone integration expands spatial coverage and operational efficiency. Advanced signal processing clarifies noisy raw thermal data. Artificial intelligence automates the defect identification process reliably.
Fusing IRT with GPR maximizes structural insights completely. These technologies optimize bridge life-cycle maintenance costs significantly. They ensure the ongoing safety of critical infrastructure.
Works cited
- Nondestructive Testing to Identify Concrete Bridge Deck Deterioration, https://www.researchgate.net/publication/355392655_Nondestructive_Testing_to_Identify_Concrete_Bridge_Deck_Deterioration
- Application of Thermal Ir Imagery for Concrete Bridge Inspection, https://www.pci.org/PCI/News-Events/Papers/2011/Transportation/Application-of-Thermal-Ir-Imagery-for-Concrete-Bridge-Inspection.aspx?WebsiteKey=5a7b2064-98c2-4c8e-9b4b-18c80973da1e
- Nondestructive Testing to Identify Concrete Bridge Deck Deterioration, https://library.ctr.utexas.edu/Presto/content/Detail.aspx?ctID=UHVibGljYXRpb25fMTE2MTA=&rID=MTY1Nzc=&ssid=c2NyZWVuSURfMTQ2MDk=
- Modelling of Chloride Diffusion through Concrete using Fick’s laws, https://www.researchgate.net/publication/259457671_Modelling_of_Chloride_Diffusion_through_Concrete_using_Fick’s_laws_of_Diffusion
- Factors Influencing Chloride Ion Diffusion in Reinforced Concrete, https://www.mdpi.com/1996-1944/17/13/3296
- Corrosion Modelling | JPBroomfield, https://www.jpbroomfield.co.uk/pages/corrosion-modelling.php
- Predicting Concrete Corrosion: The Effects of Chloride, https://www.giatecscientific.com/education/service-life-prediction-for-reinforced-concrete-exposed-to-chloride-induced-corrosion-risk/
- Evaluation of NCHRP 747 Pavement Forensic Guide for GDOT’s, https://rosap.ntl.bts.gov/view/dot/35574/dot_35574_DS1.pdf
- Infrared Thermography (IRT) – TarmacView, https://www.tarmacview.com/glossary/infrared-thermography/
- A Review of Infrared Thermography for Delamination Detection on, https://pmc.ncbi.nlm.nih.gov/articles/PMC8779359/
- Infrared Thermography for Defect Detectability in Structural Health, https://pmc.ncbi.nlm.nih.gov/articles/PMC13302904/
- Bridge – Infrared Thermography (IT) – FHWA InfoTechnology, https://infotechnology.fhwa.dot.gov/infrared-ir-thermography/
- ASTM D4788-03(2022) – Standard Test Method for Detecting, https://standards.iteh.ai/catalog/standards/astm/fc319561-b560-498b-ba5f-0c8f081b142c/astm-d4788-032022
- ASTM D4788 03 – pdfcoffee.com, https://pdfcoffee.com/astm-d4788-03-pdf-free.html
- MWIR vs. LWIR: What’s the Difference? – Sierra-Olympia Tech., https://sierraolympia.com/infrared-mwir-and-lwir-overview/
- LWIR Cameras vs MWIR: Industrial Selection Guide | LightPath, https://www.lightpath.com/blog/lwir-cameras-vs-mwir-industrial-selection-guide
- What is NETD? Noise Equivalent Temperature Difference – Pulsar, https://pulsarnv.com/pages/what-is-netd
- DJI Zenmuse H20T – DJI Ferntech, https://www.ferntech.co.nz/DJI-Zenmuse-H20T
- Bridge Deck Scanning by Infrared Thermography page 7, https://source.asnt.org/bridge-deck-scanning-by-infrared-thermography/7
- Drone-Based Infrared Thermography (Drone IRT) | TarmacView, https://www.tarmacview.com/glossary/thermography-drone/
- Ground Sampling Distance (GSD): Drone Survey Planning for, https://www.agisoftmetashape.com/ground-sampling-distance-gsd-drone-survey-planning-for-metashape/
- Ground Sample Distance (GSD): Formula, Tables & Calculator, https://www.skyebrowse.com/news/posts/ground-sample-distance
- Ground sampling distance (GSD) in photogrammetry, https://support.pix4d.com/hc/en-us/articles/202559809
- Detectability of Delamination in Concrete Structure Using Active, https://www.researchgate.net/publication/328398894_Detectability_of_Delamination_in_Concrete_Structure_Using_Active_Infrared_Thermography_in_Terms_of_Signal-to-Noise_Ratio
- (PDF) The thermographic signal reconstruction method: A powerful, https://www.researchgate.net/publication/271825580_The_thermographic_signal_reconstruction_method_A_powerful_tool_for_the_enhancement_of_transient_thermographic_images
- THE THERMOGRAPHIC SIGNAL RECONSTRUCTION METHOD, https://pmc.ncbi.nlm.nih.gov/articles/PMC4321698/
- detecting concrete abnormality using time-series thermal – arXiv, https://arxiv.org/pdf/1804.05406
- Latest Advances in Common Signal Processing of Pulsed … – MDPI, https://www.mdpi.com/2076-3417/11/24/12168
- Application of infrared thermography in concrete bridge deck, https://www.researchgate.net/publication/387424411_Application_of_infrared_thermography_in_concrete_bridge_deck_inspection_current_practices_challenges_and_future_needs
- An underwater crack detection method based on improved YOLOv8, https://www.researchgate.net/publication/386308368_An_underwater_crack_detection_method_based_on_improved_YOLOv8
- (PDF) Bridge Deck Delamination Segmentation Based on Aerial, https://www.researchgate.net/publication/333679254_Bridge_Deck_Delamination_Segmentation_Based_on_Aerial_Thermography_Through_Regularized_Grayscale_Morphological_Reconstruction_and_Gradient_Statistics
- A Structure-Aware Deep Learning Framework for Automated Bridge, https://www.mdpi.com/1424-8220/26/13/4255
- A New Multi-Modal Data Fusion Framework for Delamination … – MDPI, https://www.mdpi.com/1424-8220/26/12/3926
- One-Stop Bridge Data. New online tool combines multiple datasets, https://www.transportation.gov/utc/one-stop-bridge-data-new-online-tool-combines-multiple-datasets-bridge-performance-analysis
- The Economy of Preventive Maintenance of Concrete Bridges, https://rosap.ntl.bts.gov/view/dot/36858/dot_36858_DS1.pdf
- 109 – Bridge Preservation Strategies, https://bridgedesignmanual.deldot.gov/index.php/109_-_Bridge_Preservation_Strategies
- Bridge Rehabilitation – UHPC Solutions, https://www.uhpcsolutions.com/bridge-rehabilitation
- WisDOT Bridge Manual Chapter 40 – Bridge Rehabilitation, https://wisconsindot.gov/dtsdManuals/strct/manuals/bridge/ch40.pdf
- Bridge Deck Rehabilitation Overlay vs Full Replacement Methods, https://ifactoryapp.com/industries/infrastructure-management/bridge-deck-rehabilitation-overlay-vs-replacement