

A construction risk matrix is a likelihood × impact grid that turns a scattered list of project worries into a ranked, actionable picture. For most projects, a 5×5 matrix is the right default: it gives enough gradation to separate a nuisance delay from a schedule-killer without overwhelming a site team in a weekly meeting. Smaller, fast-moving scopes can get by on a simpler matrix with fewer gradations, such as a 3×3 or 4×4 version.
The immediate move, before reading another paragraph, is this:
- Open a risk register (a spreadsheet works fine to start).
- List your top 5 to 10 risks right now, from memory.
- Score each one for likelihood and impact using a 1 to 5 scale.
- Assign a risk owner to each item before the meeting ends.
Everything below explains how to calibrate that scoring so it holds up under scrutiny.
Key Takeaways
A construction risk matrix works only when written scoring anchors, a named risk owner per item, and a fixed review cadence are all in place at once.
| Point | Details |
|---|---|
| Default to 5×5 | It balances detail and usability for most mid to large construction projects. |
| Score is likelihood times impact | A 1 to 25 range maps to low, medium, high, and extreme bands for prioritization. |
| Anchors prevent inconsistent scoring | Write down what each likelihood and impact level means before scoring begins. |
| Track residual risk separately | If residual equals initial score, the control likely did nothing. |
| Aman supports register setup | Compliance-ready templates with version control keep scoring consistent across project phases. |
Table of Contents
- What Is a Risk Matrix and Why Does It Matter on Site?
- Should You Use a 3×3, 4×4, or 5×5 Matrix?
- How Do You Score Likelihood and Impact Consistently?
- How Do You Actually Use a Risk Matrix Step by Step?
- What Does a Filled-In 5×5 Risk Matrix Template Look Like?
- How Do You Turn Matrix Scores Into Actual Decisions?
- How Does Aman Support Consistent Risk Scoring on Live Projects?
- Why Do Risk Matrices Fail Even When Teams Fill Them Out Correctly?
- How Aman Engineering Consultancy Helps You Set Up a Working Risk Matrix
- Sources
What Is a Risk Matrix and Why Does It Matter on Site?
A construction risk matrix plots each identified risk on two axes: how likely it is to occur, and how severe the consequences would be if it does. The intersection produces a score, and that score determines where a risk lands in your register, from background noise to something that needs a stop-work conversation.
The value isn’t the grid itself. It’s what the grid forces a project team to do.
- It makes prioritization explicit instead of political — the loudest voice in the room no longer decides which risk gets attention first.
- It gives a shared language for communicating exposure to a client, a main contractor, or a statutory authority that wants evidence of a structured process.
- It allocates scarce resources (site supervision hours, temporary works checks, weather contingency budget) toward the risks that actually threaten the program.
A matrix is a qualitative decision-support tool, not a measurement instrument. Two engineers looking at the same delay risk can land on different scores if nobody has written down what “likely” or “major” actually means for that project. That gap is the single biggest reason risk matrices fail in practice, and it’s fixable with the anchor language covered next.
Should You Use a 3×3, 4×4, or 5×5 Matrix?
Matrix size should match project complexity and how often the team actually reviews it, not personal preference.
- 3×3 matrix: best for small-scope work, fast go/no-go assessments, or a subcontractor package where a five-minute toolbox talk is the whole risk conversation.
- 4×4 matrix: fits mid-sized projects that need more gradation than a 3×3 but don’t warrant a full governance layer. Useful when a team is outgrowing simple categories but doesn’t yet have a dedicated risk manager.
- 5×5 matrix: the standard for most construction projects because it balances granularity against usability, producing a 1 to 25 score range that maps cleanly to low, medium, high, and extreme bands.
- Custom matrices: build one when regulatory exposure, insurance requirements, or a client’s own risk framework demands specific categories, such as separating environmental risk from safety risk rather than blending them into one severity scale.
Bigger isn’t always better. A 7×7 matrix looks rigorous on paper but usually produces false precision, since most teams can’t reliably distinguish a likelihood of 4 from a likelihood of 5 in a live meeting.
How Do You Score Likelihood and Impact Consistently?
Every construction risk matrix runs on two axes, each scored 1 to 5, multiplied together to produce a single number between 1 and 25. The multiplication is the entire mechanism: it rewards risks that are both plausible and damaging, and it deliberately downgrades a catastrophic-but-vanishingly-rare event compared with a moderate issue that happens on every job.
The failure point isn’t the math. It’s vague labels. Risk matrices require written definitions for each level of likelihood and impact, because “likely” means something different to a site supervisor than it does to a project sponsor reviewing the register once a month.
| Level | Likelihood anchor | Impact anchor |
|---|---|---|
| 1 | Rare — has not occurred on comparable projects | Negligible — no measurable cost or schedule effect |
| 2 | Unlikely — occurs on roughly 1 in 10 similar projects | Minor — under one week delay, contained cost overrun |
| 3 | Possible — occurs on roughly 1 in 3 similar projects | Moderate — one to four week delay, budget variance requiring approval |
| 4 | Likely — has occurred on most comparable projects | Major — over a month delay, contract dispute risk |
| 5 | Almost certain — already occurring or confirmed | Severe — safety incident, structural failure, statutory stop-work order |
Statistic check: in a standard 5×5 grid, scores in the lower range fall in the low band, moderate scores in medium, higher scores in high, and the highest scores in extreme. Anything above 16 should trigger a conversation with senior management before the next scheduled review, not wait for it.
Record both the initial risk score (before any controls) and the residual risk score (after controls are applied). If the two numbers match, either the control didn’t do anything or the initial score was wrong. That comparison, drawn from field practice around 5×5 matrices on construction sites, is one of the fastest ways to catch a register that’s being filled in as a formality rather than actually used.
How Do You Actually Use a Risk Matrix Step by Step?
A matrix only earns its place in a project if the team runs the same sequence every time. Skipping steps is how registers go stale.
- Prepare the scope. Decide who attends (site manager, safety officer, design lead, subcontractor reps for major packages) and which risk categories apply: financial, safety, environmental, schedule, and design or technical.
- Identify risks. Brainstorm without filtering; every risk lands in the register first, gets scored second. A missing risk is worse than a low-scored one.
- Score using the written anchors. Rate likelihood and impact separately, then calculate the risk score by multiplying likelihood by impact.
- Plot each risk on the grid and color code by band. This step is where patterns become visible, three “medium” risks clustering in the same zone often signal a systemic issue rather than three unrelated problems.
- Assign a risk owner to every item scoring medium or above, with a named individual and a target date, and attach a mitigation action.
- Set review triggers. A weather-dependent risk needs a different review cadence than a procurement risk. Define the trigger, not just a calendar date.
Pro Tip: Assign the risk owner in the same meeting where you score the risk, not afterward over email. Ownership assigned live gets acknowledged; ownership assigned by email gets ignored until the risk becomes a problem.
The scoring step is where most teams cut corners under time pressure. A rushed 15-minute pass through 40 risks produces a register nobody trusts by month three.
What Does a Filled-In 5×5 Risk Matrix Template Look Like?
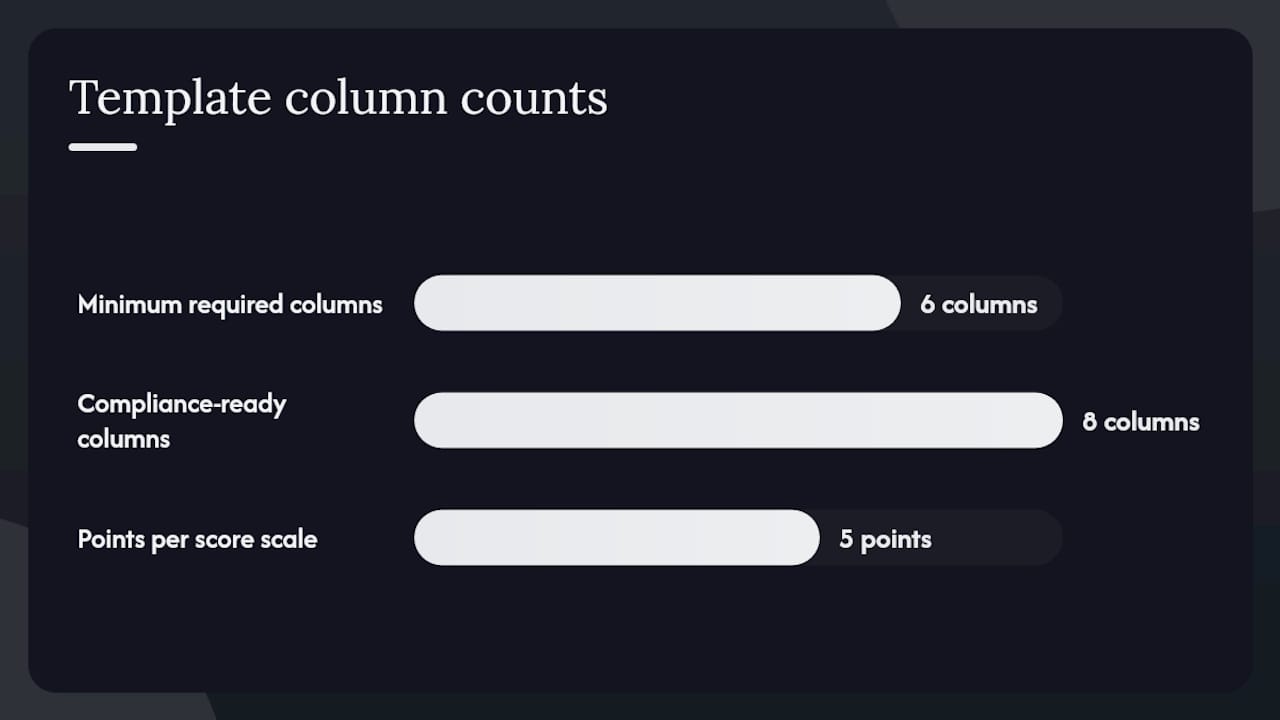
A copyable template needs six columns at minimum: risk description, category, likelihood (1 to 5), impact (1 to 5), risk score, and risk owner. Add two more for a compliance-ready version: existing controls and residual score.
Here’s a worked example using risks that show up on nearly every mid-sized construction project:
A few things worth copying directly from this layout into your own register:
- Keep initial score and residual score in separate columns rather than overwriting one with the other, so you can prove controls actually reduced exposure.
- Record the specific control against each risk, not a generic phrase like “monitor closely.” For the temporary works example, that means naming the specific engineering check and its frequency.
- Common template fields also include project phase and party responsible, which matter once a risk needs to be handed off between design and construction stages.
- Where mitigation touches a physical hazard, describe it using the hierarchy of control, eliminate, substitute, engineering control, administrative control, or PPE, rather than jumping straight to PPE as the default answer.
Aman Engineering Consultancy’s own risk assessment practice guide walks through scoring examples specific to structural and facade risk categories if you want more worked cases beyond the six above.
How Do You Turn Matrix Scores Into Actual Decisions?
A score sitting in a spreadsheet changes nothing on its own. What changes behavior is what happens after the score has been assigned.
- When two risks land on the same score, break the tie using asset criticality and regulatory exposure, a risk tied to a statutory inspection deadline outranks an equally scored risk with no compliance dimension attached.
- Every risk scoring medium or above needs a named owner with a deadline, not a department or a role title. “Site engineering team” is not an owner; “J. Tan, structural lead, due Friday” is.
- Match mitigation strategy to the risk’s nature: avoid it by redesigning the sequence, reduce it through additional controls, transfer it through insurance or subcontract terms, or accept it with documented sign-off when the cost of further mitigation outweighs the exposure.
- Set a review cadence tied to project velocity, weekly for active high-risk sites, biweekly or monthly for stable phases, and define specific escalation triggers rather than relying on the next scheduled meeting to catch a worsening risk.
Mitigation choice has direct cost and schedule consequences. Transferring a risk through insurance is often cheaper upfront than redesigning a sequence to avoid it, but it can leave the project exposed to claims delays if the risk materializes anyway. That trade-off belongs in the same conversation as the score.
How Does Aman Support Consistent Risk Scoring on Live Projects?
Inconsistent scoring is almost always a documentation problem, not a competence problem. Teams that keep their anchor definitions in someone’s head rather than in a shared, version-controlled file drift apart on what “high” means within a few months.
- Centralized digital templates with version history and comment threads keep anchor language and scoring history visible to every reviewer, rather than buried in one person’s inbox.
- Aman’s risk assessment register resources and compliance-ready checklist give teams a starting structure that already accounts for statutory submission fields.
- Align risk reviews with statutory submission and inspection milestones rather than running them on a separate calendar, so the register and the compliance file stay in sync instead of drifting apart.
| Point | Details |
|---|---|
| Default matrix size | Use a 5×5 grid for most projects; drop to 3×3 or 4×4 only for small, fast-moving scopes. |
| Written anchors prevent drift | Define what “likely” and “major” mean in writing before scoring, not during the meeting. |
| Score bands guide urgency | Scores above 16 on a 25-point scale should trigger senior review before the next scheduled meeting. |
Why Do Risk Matrices Fail Even When Teams Fill Them Out Correctly?
The three failures I see most often on construction registers have nothing to do with the math. They’re vague anchors nobody wrote down, risks with no named owner, and a matrix that gets filled in once at kickoff and never touched again.
The fix is boring but effective: write the anchors before the first scoring session, assign an owner the moment a risk scores medium or above, and review residual risk weekly on any site with active high-risk work. A matrix that isn’t revisited is a snapshot, not a management tool.
— Aman
How Aman Engineering Consultancy Helps You Set Up a Working Risk Matrix
Building the grid is the easy part. Keeping it accurate across design changes, subcontractor turnover, and shifting site conditions is where most registers quietly fall apart, and it’s the part Aman Engineering Consultancy handles for developers and contractors who don’t have a dedicated risk manager on staff.

Aman sets up compliance-ready risk assessment registers with version control built in, so anchor definitions and scoring history stay consistent even as personnel change. That work often runs alongside statutory submission support and BIM-enabled tracking, meaning your risk register lines up with the same model and documentation used for authority approvals rather than living as a disconnected spreadsheet. If your current matrix has drifted, inconsistent scores, no clear owners, stale entries, request a checklist review or template setup and get a working register back in place before your next site review.
Sources
- Risk matrix template: free guide to score project risks 2026 • Asana
- Risk Assessment Matrix: Free Template and Usage Guide | TechTarget
- Risk matrix guidance — Atlassian
- Risk Matrix Template for Excel — ProjectManager